I love AWS, but the way my company works, we often find ourselves in a position where we have to pass hosting costs through to the client, and Amazon doesn’t give you any basic utility in the console to do just that.
For example, if I wanted to break down all of the hosting costs across AWS (S3, Route 53, EC2, etc) for a particular project or even just for a particular client, I can’t just select something from a dropdown and print out an invoice I can pass along to them. Plus, the invoices are so detailed, it’s nearly impossible to eyeball it like I can usually do with Rackspace pass-through costs, where I name the servers based on the client+project and can more or less suss it out from there.
Amazon does let you tag instances and other resources you use in AWS, but again, no easy way to pull reports based on those tags in the console.
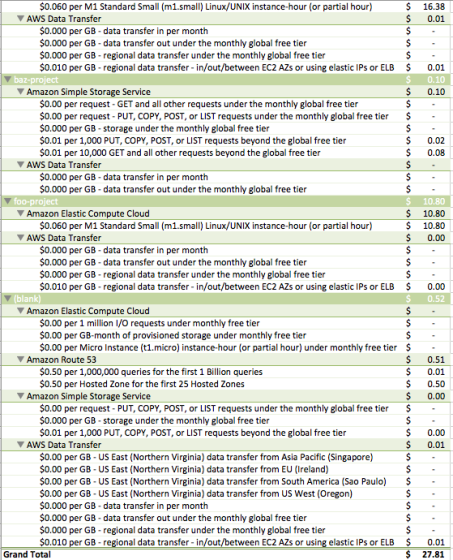
What I really wanted was a way to go from this:
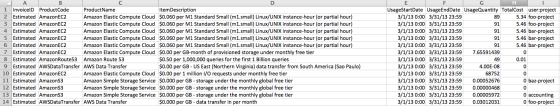
to this:
As it turns out, getting your AWS account set up so that Amazon generates a CSV version of your bill that you can grab and put into a pivot table is a lot more work than the pivot table bit itself.
The video above assumes that you’ve already completed the steps on Cost Allocation Reports, setting up an S3 bucket for your CSV dumps, and enabling programmatic billing, all outlined in the AWS documentation available here.
So as a checklist, before you can even get to the point where you have an itemized CSV to work with, you’ll need to:
[checklist]- Enable CSV reports, Programmatic and Billing Access
- Set up an S3 bucket for your CSV reports to be stored
- Opt in to the Cost Allocation Reports in your billing settings
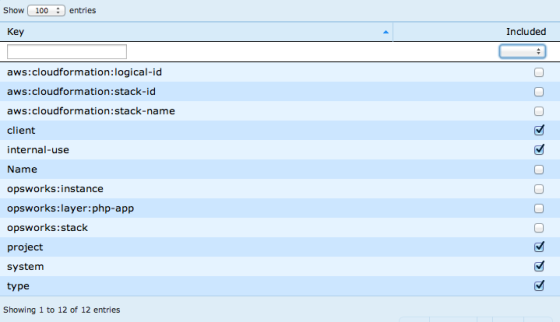
- Started assigning key/value pairs to at least some of your AWS resources
- Configured your Cost Allocation Report to include the tags you’ve associated in your CSV report
That last bit is important. You can have everything else set up perfectly, but if you haven’t configured your reports to include your tags, you’re no better off than you were before.
Once all of this is set up and you go to your S3 bucket, you’re going to see a whole bunch of CSV files. The one you want is the one that looks like XXXXXXXXXXX-aws-cost-allocation-2013-03.csv where XXXXXXXXXXX is your AWS account number. This is the one with your custom tags in it.
Update: I am including YouTube’s automatic transript of the video here, because it is amazing and hilarious.
0:01 today murder walk through creating itemized invoices by client or project

0:05 from his own web services using cost allocation reports custom tags and pivot

0:09 tables in excel

0:10 cost allocation report should be enabled in your hands on web services council

0:14 initiative or accept syntax of the purposes of this demonstration i'm going

0:17 to use a project act that created

0:20 so let's start by importing the csd that you downloaded from your

0:24 and some mystery pocket

0:34 we want to limited

0:39 and tab incumbent eliminate is fine it should be selected by default

0:44 you can see looking at r_j_r_ will quickly everything looks good

0:47 so let's go ahead and important

0:52 and a rename the sheet so that i can easily tell the difference

0:55 between my data sheet and make it a table sheet

1:01 so no need to create a new she'd and at the table

1:05 you've got to your data toolbar

1:07 go to europe it a table icon

1:09 and select create manual pivot table

1:14 next we need to actually added it to the pivot table so

1:18 we're going to go back to our original data sheet that we just imported

1:22 and then select all of the data

1:24 so start up at the top left

1:26 click and drag all the way down to the bottom right

1:29 so that all of the rose that we just imported are selected

1:42 and now we had a tear to the table

1:51 from here we can pick out which

1:53 columns and uh... values we want including the pivot table some us like

1:57 the user project

1:59 uh... which is the tenth i created specifically for this

2:02 put that on the left and then total costs and the writes about a very basic

2:05 pivot table

2:06 tissues me

2:08 how much each project cost but i want to break it down a little bit more

2:11 ice and i had an ad

2:13 uh... product name which is amazon web services product name

2:17 and the item description

2:18 and that left column so now i've got a much more robust

2:21 uh... itemized

2:23 pivot table that shows me exactly how much of it in cost per project

2:27 an arrogance left or right hand column

2:29 and just make sure that it's formatted

2:31 as currency

2:32 separate your home tab

2:36 click on the currency button

2:38 and boom dollar signs

2:41 and i like to send a check to make sure that to pick a cable total

2:44 and the total from macy's fear the same psyche are twenty seven eighty one

2:51 so you can see how easy it is you can create the tables for many key value tag

2:55 in amazon web services although if you want to have a texas cannot be tagged

3:00 mckinney questions hit me up on the twitter spy in at sleepy head
Screencast was recorded and edited using ScreenFlow. I’m sorry I talk so fast. I’m no expert at the AWS billing and invoicing stuff, but if you get stuck, feel free to ping me here or on Twitter and I’ll try to help.